
What is Data and Where can You Find It?
Before you start looking for data, it is useful to take a step back and examine what you understand by that term. Do you think of data as Excel-sheets full of numbers, as information collected by digital devices or as measurements and statistics?
Data is all of that, and much, much more. One of the broader definitions, coins it as ”information in digital form that can be transmitted or processed”. What you should take away from that, is an open mindset that allows you to see and find data in places where others might not suspect it.
The number of certain terms or phrases in a politician’s speech is data. The occurrence of extreme weather phenomenons or the occurrence of accidents in a city – all that is data. It might not be accessible as a neat Excel sheet straight away, but that does not make it less valuable as a source of information for your story.
Where to Find Story Ideas and Data Sources?
The most straightforward source for data are press releases from companies or government officials, as well as publicly accessible databases. When such information is released, ask yourself what information might be provided beyond the obvious. Can you gain new and newsworthy insights by relating the provided data to other information?
When you gather data that is available but not yet collected in a form that can be analyzed and you change that, you also gain new information.
Other sources for data and data stories include leaks and direkt informants as well as current news stories that might be given more depth when their data-background is explored.
You can find a great long-read on how to find stories as well as data sources under the following link.
Substitute Data:
Sometimes the data that you are looking for is not available. In such cases thinking about data, that is a good enough substitute for the missing information, might be the solution. For example, if you are looking for the income structure of city districts and such information is not available, the average rent prices might be an acceptable substitute.
What is Useful Data?
What sometimes occurs when journalists and news outlets first start with data journalism, is the use of data “just for show”. Time consuming data analysis is paired with fancy visualizations for stories that are either not that relevant or don’t benefit from the information that the data provides. Impact wise, this is a lot of work for very little bang. When you approach a data story, ask yourself, if it really is a data story: Is the data necessary to tell the story? Does the inclusion of graphs and visualizations make the story better? Does the data provide new information? If you can’t answer at least one of these questions with yes, your story is most likely not a data story.
Basic Skills for Data Journalists
You don’t have to be an expert in statistics or learn coding right away to analyze data. But there are some things you should make yourself familiar with, before you approach your first data project.
1. Math for Data Journalists
More often than not data-analysis is related to some kind of frequency concept. Making yourself familiar with some basic numerical terms will help you understand what kind of questions you can answer with your data and what stories can be realized with the help of data analysis.
Frequency per analytical entity/density:
How often does a piece of data occur in your analytical entity? This is an important question since it opens up the possibility to better compare numbers with each other. For example, if you are looking into the state of medical care in your city, an interesting measure of frequency might be the number of doctors per city district.
Mean:
The mean is what most people understand as the average. It is the number you obtain, by dividing a sum of values through the number of values.
If we have five city districts with 5, 9, 15, 25 and 27 doctors respectively, this is how you would calculate the mean:
(5+9+15+25+27)/5 = 16,2
The mean of doctors per city district is the division of the sum of doctors from each city district (most likely the number of doctors in the city) through the number of city districts. You can use the mean for example, to evaluate whether the number of doctors in a city district is unusually high or low.
Median:
The median, quite literally, is the number in the middle. It is not the average across a group, but rather in the middle, compared to all the other values you have. If you line up your data values from largest to smallest, the number in the center is the median. Sticking to our example, if the number of doctors in a city’s district is 5, 9, 15, 25, 27, then the median would be 15 – the number in the middle.
Mode:
The mode is the element that appears most frequently in a given set of elements. Sticking to the doctors example, the mode could be the most frequently occurring number of doctors per city district. If most city districts have eleven doctors, that would be the mode. It is another number you can use for comparative purposes. In any group it describes the most popular (aka. most frequently appearing) element.
While these concepts are important, the mathematical foundation that you will need, if you want to stick to data journalism long-term, is a little broader. You should also look into percentages and basic statistical concepts.
Here are a few resources to get you started:
- This article provides you with a short, explanatory overview of important concepts for data journalists.
- This overview by math geek and journalist Robert Niles offers a well written and approachable introduction into basic mathematical and statistical concepts, tailored towards journalists.
- If you are unfamiliar with statistical concepts, this slideshow by the Center for investigative Journalism offers a good introduction.
2. Comparative Data
The examples under point one have shown that Data-stories often deal with more than one source or kind of data. For the example story the main source of data and the main concept of interest is the number of doctors in a city. But to actually gain useful information, comparative data is needed. That could be the number and size of city districts, demographic data like income distribution or maybe the average population age in each city district. Good data stories require critical thinking about this comparative data. What kind of data is available, what kind of comparisons make sense and are the different kinds of data in a comparable format?
Sticking to our example, you could determine how the number of doctors per city district is connected to people’s income. In this case income would be the comparative data of your choice. You could then answer the question, whether the number of doctors is higher in richer or in poorer parts of the city.
This visualization of medical care in a fictional city shows that city districts with a higher household income also seem to be the ones with the highest numbers of doctors.
Another form of comparison is that of data over time. How do certain numbers, like the density of doctors in a city develop over time? Are there moments of critical change and can you acquire information that would explain these changes?
This is what a visualization of the number of doctors in a city over several years could look like.
Comparing data points within a group might also be useful. Sticking to our example you might gain some insight into which factors determine the number of doctors per city district when you look at the districts with the highest and lowest numbers of doctors.
This is what a visualization of the number of doctors across several city districts at one moment in time could look like. You see at one which districts have the highest and lowest numbers of doctors and could use this graph to illustrate and could investigate the reasons.
3. The Most Important Data Format for Journalists:
Analyzing data requires the ability to access the files in which data is stored. The most common format for data storage are so called CSV files. CSV is short for “comma separated values”. It is a simple text file and the single values that would be stored in their own cells in tables are separated from each other by commas. In some cases the values are separated by a semicolon instead of a comma, which is something to keep in mind, when you open these files. Sometimes you also need to change the decimal point to comma or vice versa, in order for Excel to read the file correctly. You can read more about that here.
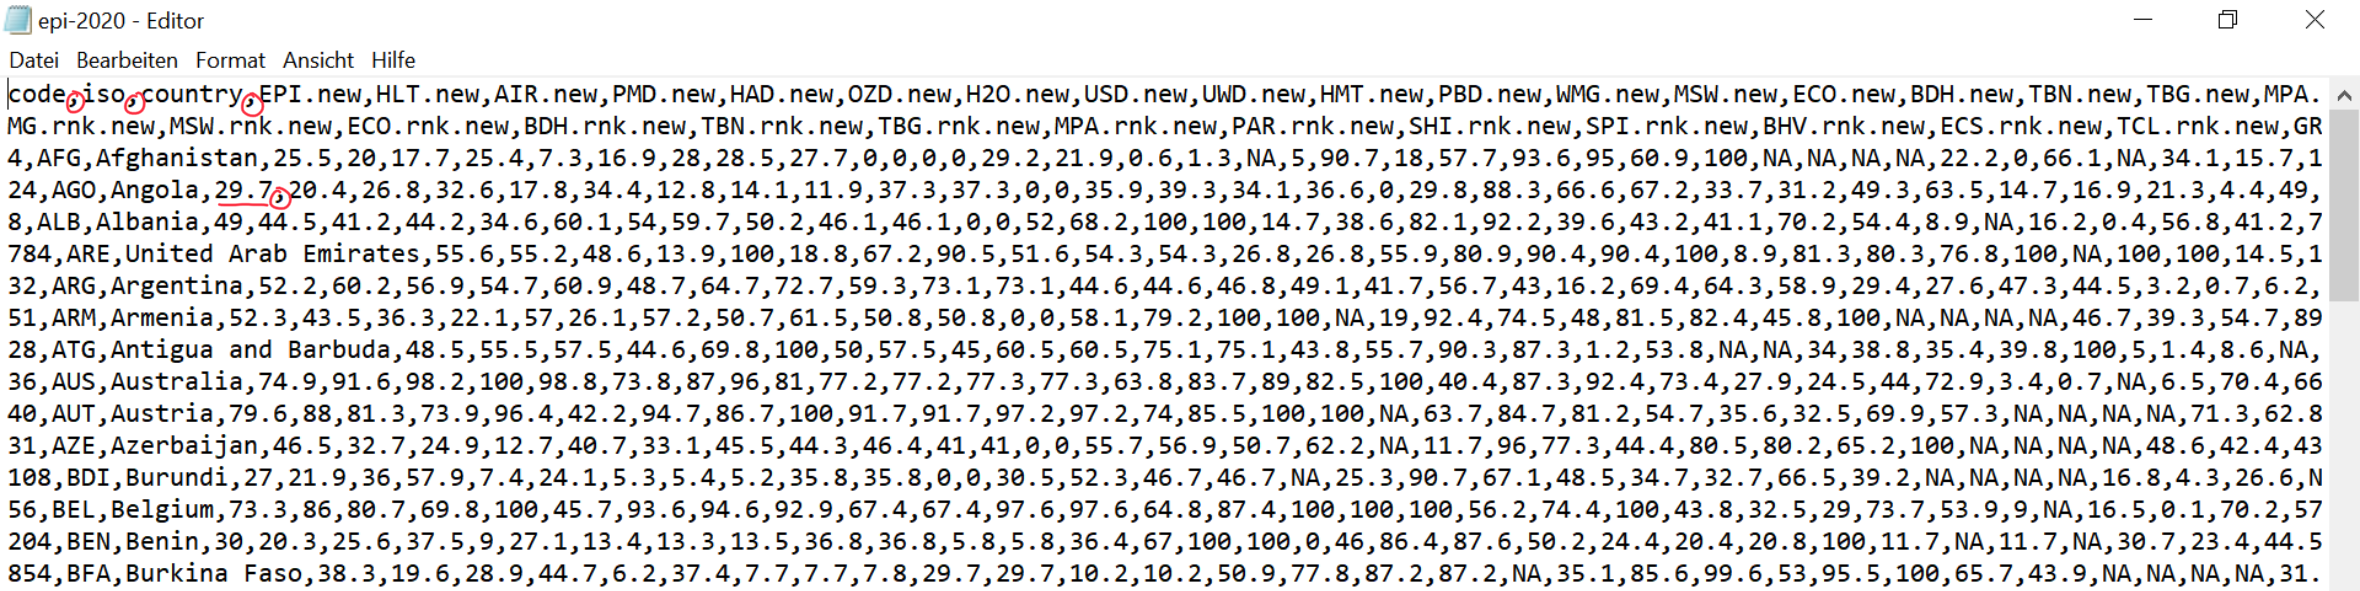
As you can see in the screenshot a CSV file that is opened in a text editor can look like complicated nonsense. If you look closer, however, you will discover the different column names and values of the columns, separated by commas. If you import a CSV file into excel you can rediscover the words from the first screenshot that Excel read correctly as column names.
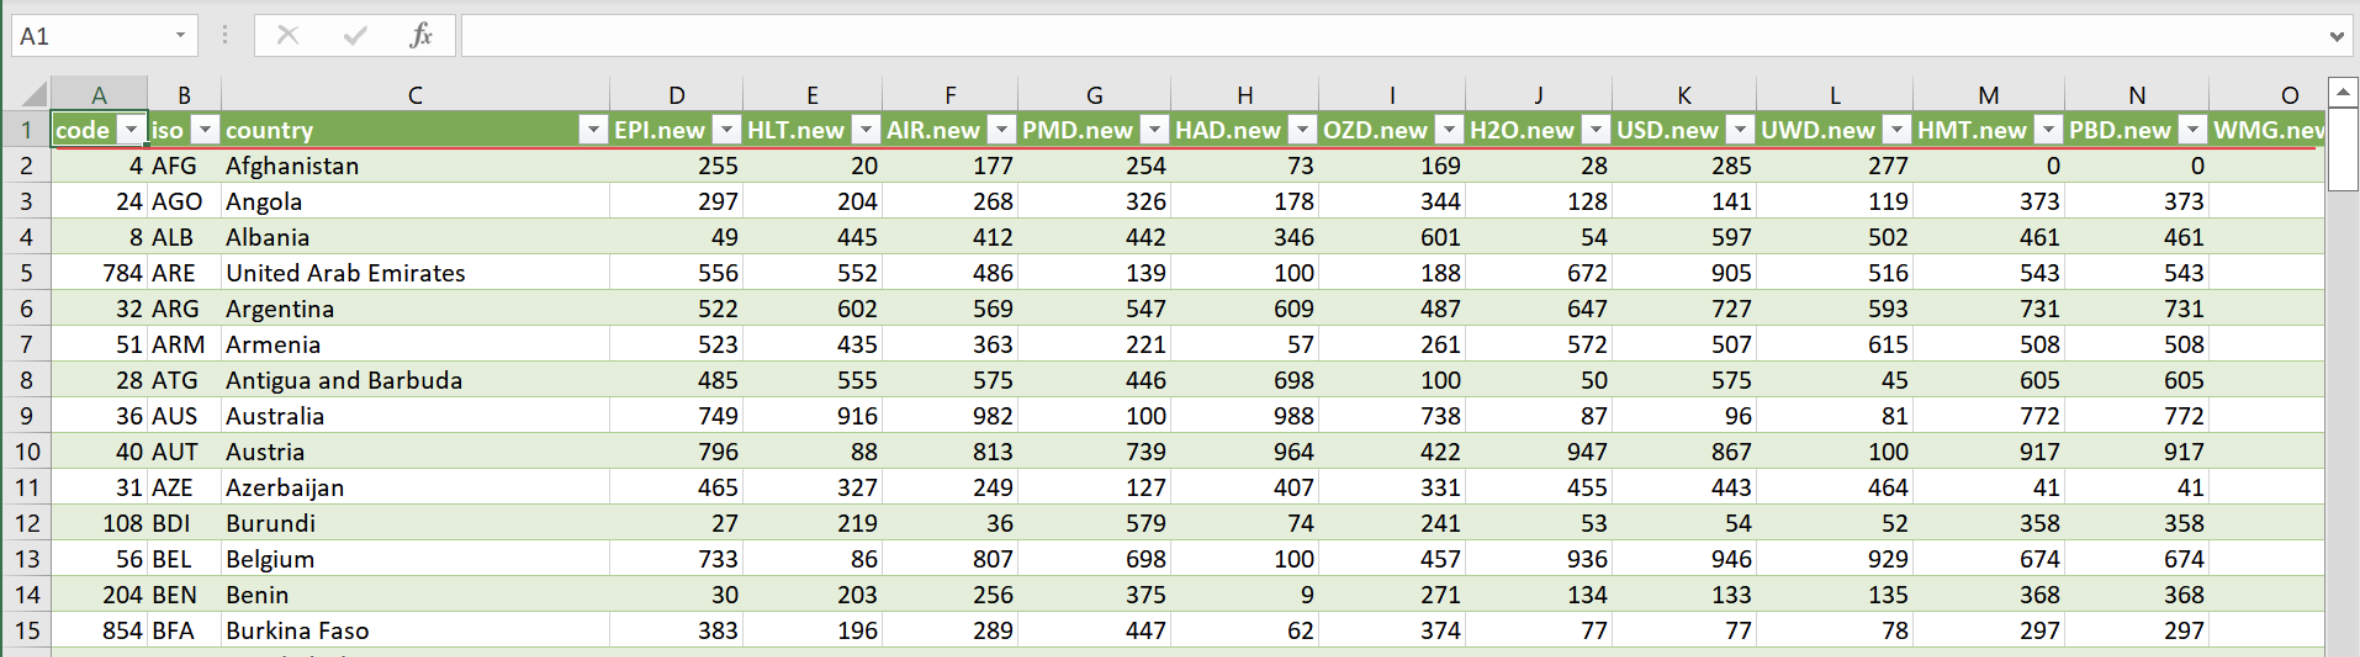
CSV files are so widely used to store data, because they can contain a lot of information while still being relatively small in comparison to excel files. Apart from that, all kinds of programs are able to read and open CSV files. Program-languages such as R and Python, as well as spreadsheet-programs, are all able to work with them. Once you have opened a CSV file in the program of your choice, you can treat it like any other table or data frame and perform analytics on the values stored within.
4. The Web is Your Best Friend
If you run into any problems in the process of Data Analysis, it is good to know that there is a huge community ready to help. From seemingly trivial problems, like not being able to open a csv-file with Excel to tricky coding issues: The odds are quite high that someone has run into a similar problem before and has posted the solution online. Forums such as Github are meeting places for people who are happy to help.
If you look for solutions to your problems, it is important to state the nature of the problem as well as the name of the program you are working with. From there, you usually have to click through a couple of results until you find the one matching your problem.
Data Journalism Without Coding
To analyze data and become a data journalist you don’t have to learn coding right away. Many basic analyses and data journalism stories can be done with much more approachable non-coding programs. Here is an overview of skills and programs you need to get started with data journalism:
1. Excel for Data Journalists
Excel is the most widely used spreadsheet software and nothing to be afraid of. Some very basic skills will already enable you to work with tables and CSV files and do your data stories with Excel. You can create pivot tables and sort values ranking from highest to lowest or vice versa. You can also do calculations like proportions and percentages. Here are some resources, if you want to learn how to use Excel for analytical and journalistic purposes:
School of Data: Free online read along, which explains topics like filtering, sorting (highes and lowest values) and how to use math and text functions in Excel. It also introduces you to the highly useful magic of pivot tables.
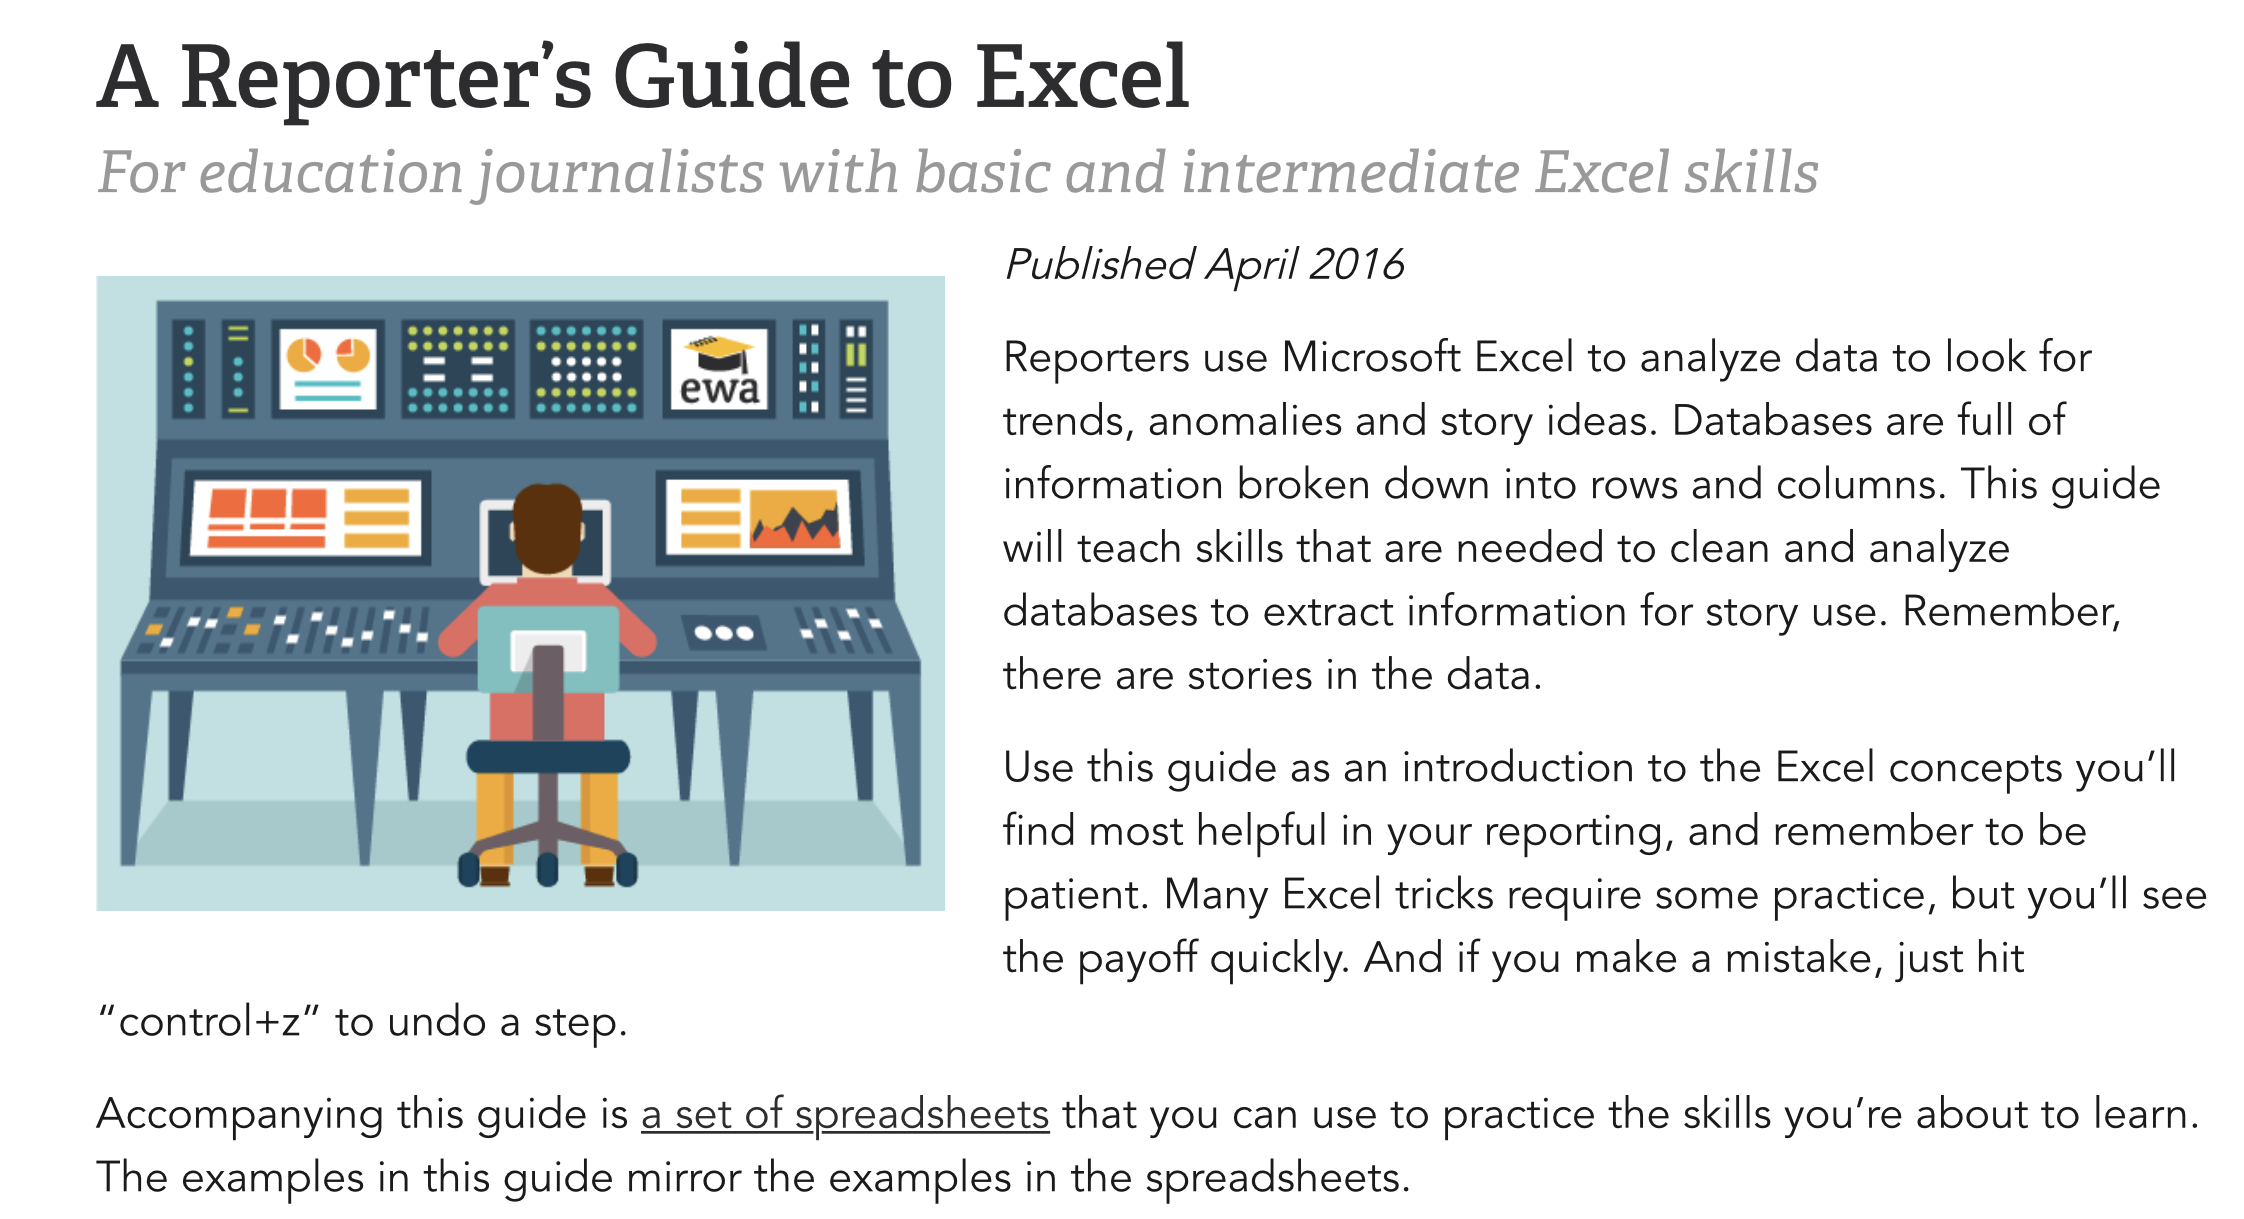
A Reporter’s Guide to Excel: This tutorial takes you gently through the most important functions of Excel. It is based on a 2016 version of the software but it still provides a great overview.
MrExcel: A website dedicated entirely to the opportunities and problems of Excel. It has a great collection of tips on a wide variety of topics and issues.
Additionally, Youtube is a great resource for free introductions into the program and googling specific problems will save you a lot of time and trouble.
2. Data Journalism With Google Sheets
Google Sheets is a spreadsheet program that is similar to Excel in its basic functions. Contrary to Excel it is free, cloud based and can be accessed from anywhere and by multiple people at the same time. The disadvantage is that it does not come with as many built in functions as Excel. It also gets slower, the more data you are trying to process.
Learn to work with Google Sheets:
Google Workspace Learning Center: Google provides quite an extensive online platform where a lot of the functionalities of Google Sheets are explained. From basic functions to cheat sheets, this website got you covered.
Ben Collins - A Beginner’s Guide: If you don’t want to rely on Google’s own instructions, this site provides you with a lot of introductions to different sheets-related topics. From total beginner to more advanced topics. The website provides a lot of information free of charge but if you want to access the video courses, you will have to pay.
Journalist’s Toolbox: Spreadsheets: Playlist with four concise Youtube tutorials that take you through the basics of Google Sheets, as well as different options for its application.
3. How to Extract Data from PDFs
Tabula is a very helpful tool that comes in handy when you want to analyze data that is stored in PDF documents. Spreadsheet programs can’t open PDF files, but Tabula is here to help: It converts a table in a PDF into a csv file that you can then open in the Spreadsheet-program of your choice. Tabula can be extremely helpful, but it sometimes suffers from buggs. These are unlikely to be fixed, because it was created as a free and voluntary project by software engineers and data journalists from the US.
Tabula is very easy to use. Here are two good tutorials, that will set you up:
How to use Tabula to extract Tables from PDFs
Extracting Data from PDFs using Tabula
This GitHub site is also a good resource on how to use Tabula to extract data tables from PDFs.